| ProFootballLogic | ||||||||||
| ARTICLES | TEAMS | STATS | RATINGS | STANDINGS | GAMES | SCHEDULE | PLAYERS | METHOD | SPORTS | |
2018 World Cup Odds Chart
By Michael Gertz
Tuesday, June 19, 2018
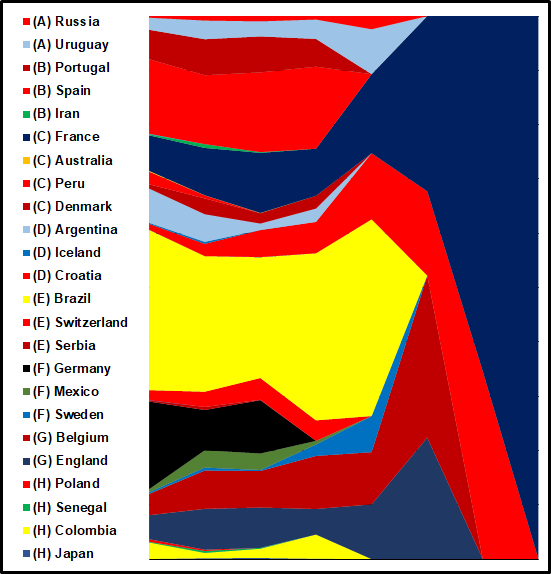
Below is a chart of odds that each team will win the 2018 World Cup. It is based on data that can be found in table form in our Soccer page.
The vertical length of each team's color represents their odds of winning the entire tournament, with the entire height of the chart representing all simulated scenarios. The odds on the left are pre-tournament, while each differing point to the right represents the updated odds after each set of 1 game for each team. Only teams that at any point had over a 0.1% chance of winning the World Cup are listed.
Odds are updated through the tournament, with the right side being through the completed final.

| Recent Articles |
|---|
| If 2021 Had 16 Games - 1/10/22 |
| Wk 18 Playoff Scenarios 2021 - 1/8/22 |
| Wk 17 Playoff Scenarios 2020 - 1/1/21 |
| Wk 17 Playoff Scenarios 2019 - 12/27/19 |
| 2 Week Playoff Scenarios 2019 - 12/21/19 |
| 3 Week Playoff Tiebreakers 2019 - 12/11/19 |
| NFL Injury Point Value - 6/18/19 |
| How Teams Value Draft Picks - 4/25/19 |
| Analyzing The Zion Injury - 3/21/19 |
| Week 17 Playoff Scenarios 2018 - 12/27/18 |
| BUF | MIA | NE | NYJ | BAL | CIN | CLE | PIT | HOU | IND | JAC | TEN | DEN | KC | LV | LAC | |||||||||||||
| DAL | NYG | PHI | WAS | CHI | DET | GB | MIN | ATL | CAR | NO | TB | ARI | LAR | SF | SEA | |||||||||||||
| ProFootballLogic.com welcomes questions, requests, and error reports by email to contact@profootballlogic.com | ||||||||||||||||||||||||||||
| Privacy Policy | ||||||||||||||||||||||||||||
| Copyright © 2025 ProFootballLogic.com. All Rights Reserved. | ||||||||||||||||||||||||||||