|
|
||||||||||
| ARTICLES | TEAMS | STATS | RATINGS | STANDINGS | GAMES | SCHEDULE | PLAYERS | METHOD | SPORTS | |
NFL Draft Pick Value
By Michael Gertz
Wednesday, April 26, 2018
Is the 4th overall pick in the NFL draft worth more than the 64th pick?
It seems like a ludicrous question. The whole NFL runs on the assumption that the higher the draft pick, the more valuable it is. What are the chances that just about every NFL front office, media member, and fan is wrong about that?
But think about how complex the analysis actually is in order to answer that question. Obviously, a player selcted 4th is likely to be better than the player selected 64th. That's about the extent to which the average media analyst typically goes. We see this when a good player gets traded for a 6th round pick. "How could you possibly trade him for a 6th?" the TV personalities will say.
Of course, the answer is his contract, which often doesn't even get mentioned. When a player has a salary higher than the value he brings, he gets cut. Most people see the logic in this. But when a player brings a value only slightly higher than his salary, people have a hard time admitting that the player (together with his contract) at that point are only worth something like a 6th round pick. Probably because his on-field impact is easier to imagine than the theoretical on-field impact of other players that could be given the equivalent salary.
Once we get over the complication of a player's actual value being relative to their salary, the initial question becomes a bit harder to answer. The 4th overall pick will get paid around a guaranteed $7 million per year. The 64th pick will earn about $1 million/year. So let's rephrase the qustion:
Is the 4th overall player in the NFL draft worth more than the 64th player plus $6 million/year in salary cap room?
If we'd asked this question originally, you probably wouldn't be so quick to dismiss it. After all, most people are quick to point out that even the top picks in the draft are busts around half the time. Maybe you'd be better off with the 64th and spending the $6 million/year on a solid starter than having the 4th overall pick, who may be great or may be useless. Certainly, at very least it's something that's debatable and not nearly as black and white as everyone thinks it is.
Analyzing Draft Pick Impact
Now that we have a baseline understanding of the actual complexity of the problem, let's do our best to solve it. The biggest impediment to this traditionally is evaluating the actual on-field impact of players that are drafted. Many would say that itself is already too tough and subjective, so you're best off just letting the GM's trust their guts.
Others have developed rough metrics utiilizing basic stats like games played, starts, and Pro Bowls. The better of these rough metrics even include different in-game stats for different positions, like Pro-Football-Reference.com does with their AV (Approximate Value) metric. The best draft analyses using these metrics have come from an academic paper by Cade Massey and Richard Thaler, and a great Follow-Up on it by Brian Burke. And they've come to some rather unorthodox conclusions that the top picks are potentially very overvalued.
The great advantage we have at ProFootballLogic is an extensive Player Rating Database, with ratings for every player for each season back to 2009. Our ratings are subjective and not perfect, as none can be, but are based on extensive research and analysis, and certainly present an upgrade on the simpler automated metrics above.
Further, we've Analyzed the On-Field Impact of players based on both their rating and position such that the team totals for all their players reflect how well the team actually performed in various categories and overall. And this analysis accounts for the proportion of snaps each player played in each season. A crucial aspect of it is that unlike other metrics mentioned above, our impact values are in the units of net points per game. This means they are directly translatable into team ratings and game odds.
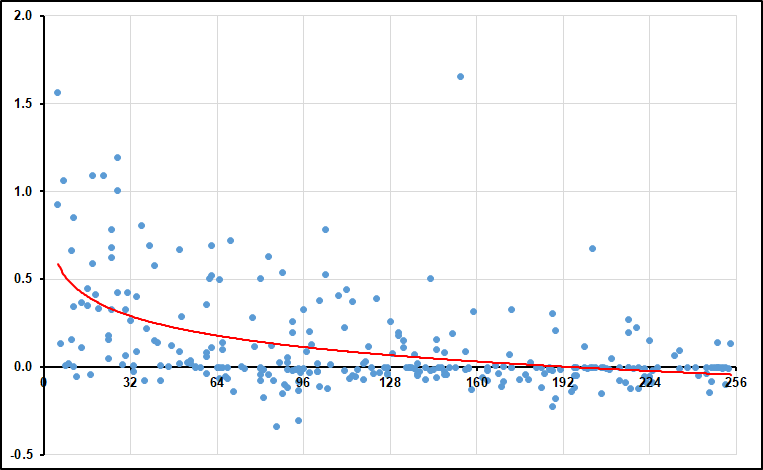
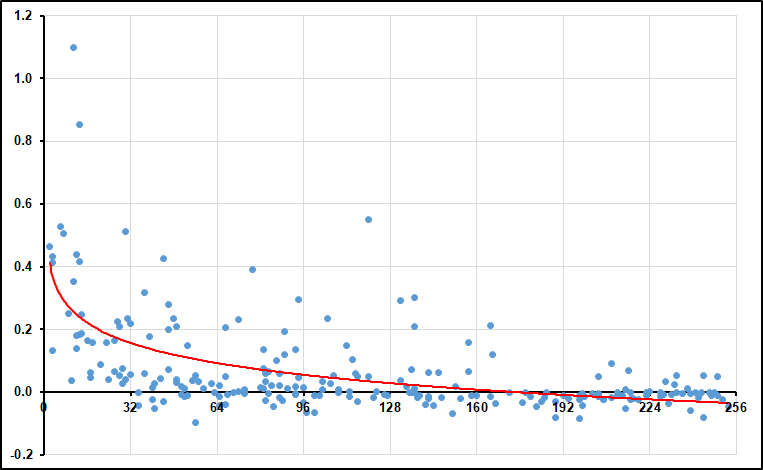
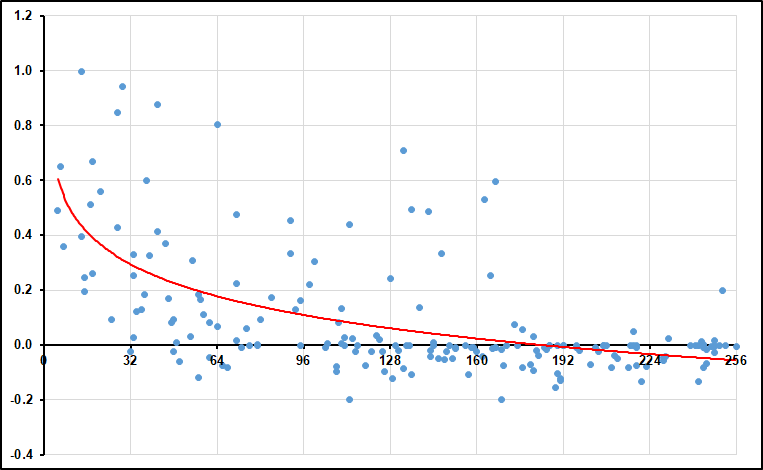
Below is a graph showing this impact of every player drafted from 2009-2017, relative to a replacement level player. The y-axis is framed for visibility, but some players are above or below the limits of the graph. The values represent the average over a player's first 4 seasons, which coincides with their rookie contract.
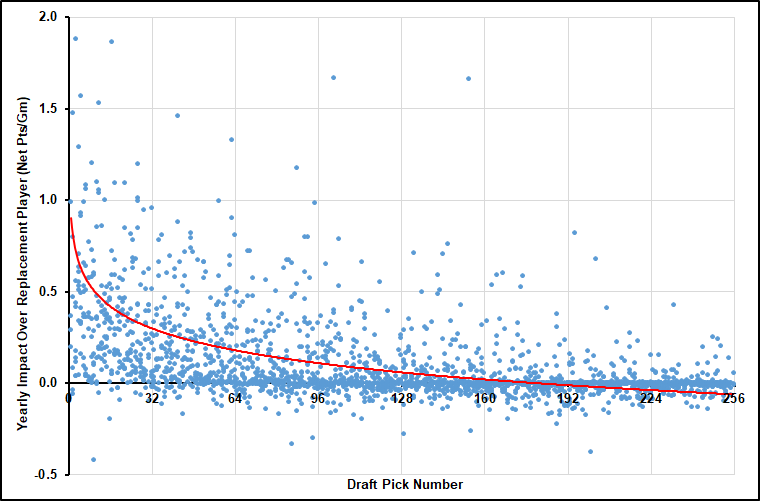
The trendline is based on a natural log. We don't have any real theoretical justification for this, but it captures the steep increase at the top of the draft better than a polynomial fit. However, it trends below zero towards the end of the draft which doesn't appear to be very justified. The data skews toward the higher values, so the trendline mean appears higher than the median player would perform, but it shoes the top pick benefitting a team by almost 1 net point/game more than a replacement player.
Of course, evaluating the quality of a "replacement player" is a key aspect of this analysis, and it is a surprisingly difficult thing to do. For our purposes, we have assigned a player rating of 77 as that of a replacement player, who essentially has no value above their league minimum salary. This is our best estimate for the typical rating of a veteran player that can be signed to a minimum contract during the season.
Later, we will address how the impact values vary by the playing position of the player drafted. But first let's examine how this generic impact value translates into a value for a draft pick.
Impact Vs Salary
We now have a good estimate of the impact different draft picks typically have on their teams, but as mentioned originally that's only half the story. So now we need to compare that impact to the salary that will be given to players at each draft pick. That's because the true value of the draft pick itself is the difference between the two.
In a broader analysis of the league as a whole, we have found that every 1 net point/game of impact above replacement level is worth about $9 million of yearly salary. With the above trendline for impact translated into salary using that ratio (plus about $0.6M minimum salary), we get the salary value of a player's expected production in the graph below. This can then be compared to actual annual average salaries of the 2017 draft class in the same graph.
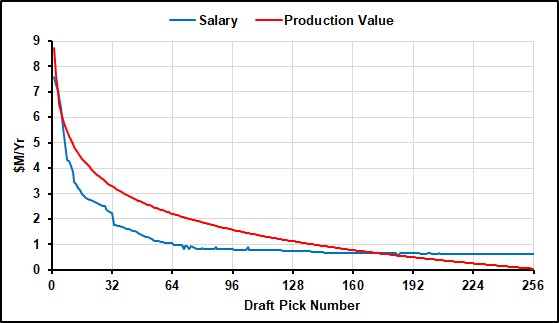
The red line represents our estimate of the average market value of drafted players, while the blue line is their actual rookie contract salary. The amount the red line is above the blue represents the true value of each individual pick itself. As expected, most picks do appear to offer net positive value. But the amount of value isn't simply higher the higher the draft pick is, as teams generally assume. Below is a clearer graph of the overall net value itself.
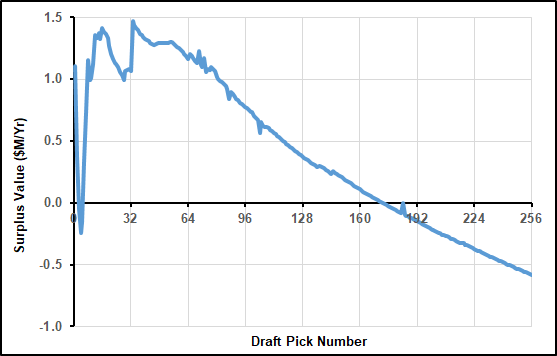
The overall pick value fluctuates rapidly in the top 8 picks. It begins high at the 1st overall pick, then drops all the way to negative value for the 4th overall pick. But by the 8th, it is already all the way back to the value of the first pick. From there, the value stays somewhat similar all the way into the 3rd round.
One caveat to our figures is that all 1st round pick rookie contracts come with a team option for a 5th year. The option is typically pretty pricey, but can be below market value for players who exceed expectations. Teams also value the 1-year nature of the option as it requires less risk than a long term deal. Because of the 5th year option, the whole 1st round could be considered to be slightly above where their values are on the graph above. Even so, 1st round picks don't appear to offer any real value over 2nd round picks on average because there is a sudden drop off in salary at the 1st pick of the 2nd round (#33), which increases their surplus value.
Starting around the beginning of the 3rd round, a picks do follow the general expectations, becoming less valuable with each selection. Around the 5th round, picks essentially have negligible value. Keep in mind our tick marks every 32 picks don't line up with the draft rounds starting at the end of the 3rd round due to the compensatory picks.
Our natural log trendline then sends the pick values negative in the final rounds, but as stated above a better fit for those rounds would probably level off around zero, as the players offer very little impact but also come at near the league minimum salary. It could make sense that some later picks did on average offer negative value if they are generally useless but teams feel obliged to hold on to and play the players. However, the data appears to show that if it does go below zero, it is not by much.
Are Teams Really This Oblivious?
It seems crazy to suggest that every team in the NFL is constantly bungling the draft. But there are a few reasons to believe that may not actually be so far from the truth. First, our draft pick value chart aligns relatively closely to that of the other draft pick value studies mentioned above, even while being produced from a completely different data set. Meanwhile, there don't appear to be any public studies available that actually come to conclusions anywhere near the current status quo.
Perhaps the best indication that NFL teams generally follow their gut rather than hard evidence in valuing draft picks was the lack of different trading values before and after rookie contracts massively decreased in value starting in the 2011 season due to the new CBA. Since rookie contract salaries greatly influence the analysis, top draft picks should have been even more useless in the years leading up to 2010, when they were essentially paid Pro Bowl caliber salaries.
Teams did appear to take note as the rookie salaries inflated, but only in their apprehension to trade up rather than by actually adjusting the price associated with such trades. This shows a league-wide inflexibility and inability to actually calculate varying trade values. While many wisely avoided trading up during that time, many others were too stubborn to drop the price they were willing to take in order to wisely trade down.
The final piece of evidence that teams aren't actually doing the analysis is the lack of trends in draft pick trades. While teams do trade a large amount of picks, they generally seem to do so in order to acquire certain players, rather than to move into certain areas of the draft. The explanation behind this is that all teams are basically valuing all draft picks rather similarly. That would very unlikely be the case if teams were actually doing their own individual analyses of draft pick value, unless they'd all already come to the same simple and obvious conclusion.
The biggest exception to this would anecdotally be that the Patriots like to trade back in the draft. This stereotype does appear to have some merit, although the tendency hasn't been quite as strong as some might think, and not nearly strong enough to come anywhere near what our analysis would recommend. That said, it is telling that the most successful team in the league appears to be the only one generally deviating from the status quo, and the deviation does appear to be toward our recommendations.
Extraordinary claims require extraordinary evidence. But while we stand by our evidence above as very strong though probably not perfect, the other important side of the equation is that our claim isn't actually as extraordinary as one might think. An extraordinary claim would be that all 32 teams independently came to the same very wrong conclusion in a system where costs and rewards are rather transparent. However, our claim is that the teams' decision making is highly correlated, the costs and rewards are very tough to see (as we'll address below), and the main reason behind the error is rather simple: laziness.
Just about all major market inefficiencies in sports follow this pattern: the times have changed but the teams haven't. As passing and going for 4th downs became easier in the NFL, teams were slow to adapt. And as the data began to pour in that 3-pointers and on-base percentage were big keys to winning, NBA and MLB teams were slow to adapt. The NFL Draft fits the trend. Much about the draft and its associated salaries has changed, but teams are slow to adapt.
In fact, most teams still seem to simply follow a draft pick value chart almost identical to the original one produced by Jimmy Johnson in the early 1990s. Due to fear or laziness, teams haven't attempted to calculate a different chart despite massive differences in rookie salaries and the salary cap being introduced since then.
The other constant in sports ignorance is letting the tail wag the dog, in the form of general managers letting ignorant fans and owners influence their decision making. And it's actually hard to blame them for doing so, as often making better decisions will only lead to small improvements while causing massive backlash. And such backlash can lead to being fired after any single outlier down season. But this effect has huge implications for the league as a whole. Just imagine what would be said of a team that traded out of the 1st round in 3 consecutive seasons, whether or not it was a brilliant decision.
The Invisible Hand Is Small (For Now)
The final piece of the puzzle is that teams can partake in good or horrible draft strategies for years and still not really feel the effects too strongly. This is because the variation from individual player outcomes is much larger than the general variation in specific pick valuation strategies. A great draft trade like trading a 1st rounder for multiple 2nd and 3rd round picks may still only net a team a few million dollars in yearly value on average. Meanwhile, any of those individual players turning out to be a Pro Bowler or a bust could dwarf that value.
In theory, if any team was much better at evaluating prospects than others, this would mean that just getting the most undervalued players was more important than moving to the right spots in the draft. This appears to be how most teams operate. But in reality, there is little evidence that some teams massively outperform others in this area, meaning the individual player performance is generally random and unpredictable, so moving to the right spots in the draft is the most important aspect.
The fact that the way teams draft doesn't vary enough currently for the truth to become apparent (via the invisible hand of the market) means that although there may be a very big benefit to a very extreme draft strategy (as our analysis suggests), the market won't naturally tend to this optimal equilibrium because the noise around the signal is so strong. That said, our analysis suggests that large benefits could actually be gained from a more unorthodox strategy.
What Should Teams Do?
It's quite possible that our draft analysis is off a little. It's possible that 1 net point/game is actually worth more like $10 million rather than $9 million. It's possible that our replacement level player rating of 77 should be a little higher or lower. But even in the extremes of those cases, it's very difficult to imagine any scenario where our analysis is so far off that it at all resembles the way NFL teams behave.
So even if our analysis is slightly off, there still seems to be a very good chance that teams could do a lot better by tending toward our results. What that would mean is never drafting in the 1st round, and especially avoiding picks 3-6. While our analysis says many 1st round picks aren't worth more than 2nd and even many 3rd round picks, that doesn't mean that a team would trade a 1st round pick for a 2nd rounder straight up. Due to the current market, trading out of the 1st round can still net a team multiple 2nd or 3rd round picks, which is where the value could really start to pile up.
It could also make sense to trade up from the 6th and 7th rounds for picks in the 4th or 5th rounds. Therefore an optimal draft strategy could be to turn a single pick in each round into something at least as good as 2 2nd round picks, 3 3rd round picks, and 2 4th round picks. Such a strategy could produce a similar amount of on-field production for a fraction of the price, leaving more money to sign free agents.
As stated above, the gains to such a strategy could still be minimal for a given draft class. Something on the order of netting an extra $4 million in salary cap space per year. But with about 4 years worth of rookie contracts on a team at any given time, it could add up to around $16 million in savings overall at any given time, which essentially provides a team the ability to sign an extra All-Pro level player.
Trading Picks For Players
Another great thing about our analysis being performed in useful units like net points/game and salary figures is that it easily relates draft picks to free agents and player trades. The first important aspect is that the same valuation of draft picks applies to trading them for players. 1st round picks being massively overvalued means they can not only be traded for a more valuable combination of lower picks, but they can be traded for valuable players as well.
And our analysis makes this typically messy and random process rather simple to quantify. For instance, valuing the 1st overall pick at about $1 million/year (over 4 years) means our analysis suggests it has similar value to a player with 1 year left on his contract with a salary about $4 million under what he's worth. As trades typically occur in the NFL, that means 1st round pick for player trades are typically won by the team acquiring the player, as the player is usually assumed to provide more than $4 million in surplus value over their market value.
Likewise, 3rd round picks tend to be the opposite. While we estimate they have just as much value as 1st round picks generally, they are often traded for much less valuable players. In general, players traded for 3rd round picks are probably assumed to have a bit less than $4 million in surplus value, and as such the team acquiring the draft pick probably often but not always win those trades.
Analysis By Position
While the analysis above represents the overall average for teams drafting players of any position, we do also find large differences in the value of picks depending on the position of the player selected. Generally, our confidence in specific draft pick value by a player's position is a bit lower than the overall average, as it is based on smaller sample sizes.
Also, it relies heavily on our analysis of the relative importance of different positions on the football field mentioned above from our Team Ratings Model. As such, the value of drafting certain positions goes hand in hand with how much importance we've assigned to the different positions, and what that implies their salaries should be as well.
Like our draft analysis, our positional importance ratings may not be perfect, but they do vary enough to think that there are important positional differences that are also often being missed by teams.
The most dramatic of which is that quarterbacks are massively undervalued, both on the free agent market and during the draft. Even though their success rate is similar to other positions, the impact on teams of the quarterbacks that do succeed is so massive that it dwarfs all the other positions. Even beyond this, QBs are the only position that if successful are likely to sign a 2nd contract with the team that drafted them for well under market value.
As such, our conclusions above generally go out the window when QBs are drafted. Picks spent on QBs offer so much surplus value, that they do generally follow the assumption that the higher the pick the higher the value. Accordingly, the generic position conclusions are even stronger for all non-QB picks. Another important aspect for QB picks is that their value remains ridiculously high even into the middle rounds. Our data suggests picking a QB in even the 3rd round can be more impactful on average (even apart from the lower salary) than a 1st rounder at many other positions. Doing so is essentially a gamble, but the occasional payoff (like Russell Wilson or Dak Prescott) is well worth the low success rate.
As mentioned in the linked article, the variation among other positions is small compared to that with quarterbacks, but there are still large relative differences between positions. Generally, positions that operate in more space with more athleticism are worth up to twice as much as positions such as linemen in our estimation. While teams appear to have realized this to some extent for certain positions, they seem to have poorly estimated the value of others.
Interior offensive lineman are generally drafted lower than other positions as they should be, but other positions such as tight end, defensive backs, and running back are often also downgraded despite our analysis showing no good reason for doing so. Meanwhile, other positions such as edge rushers and offensive tackles are often drafted very high despite our analysis showing that they offer relatively little impact on average. In that case teams perhaps rightly see the importance of the pass game, but the pass rush actually seems to be the least important part of the pass game.
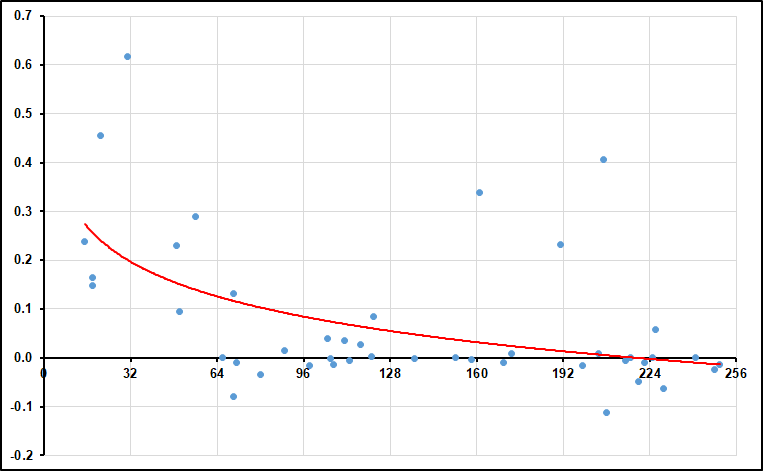
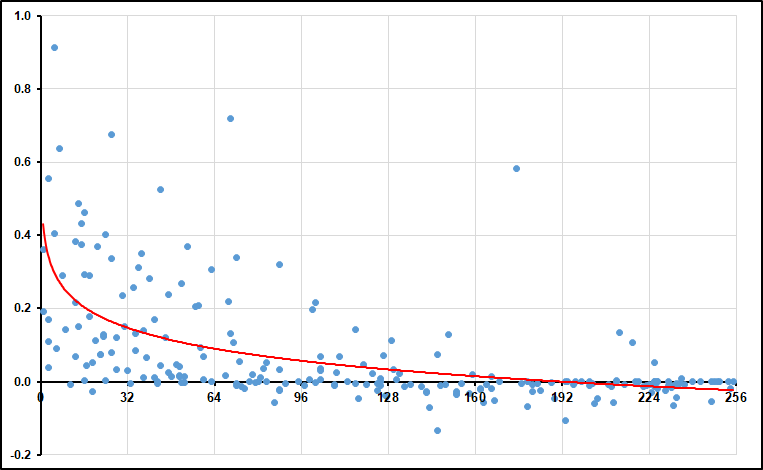
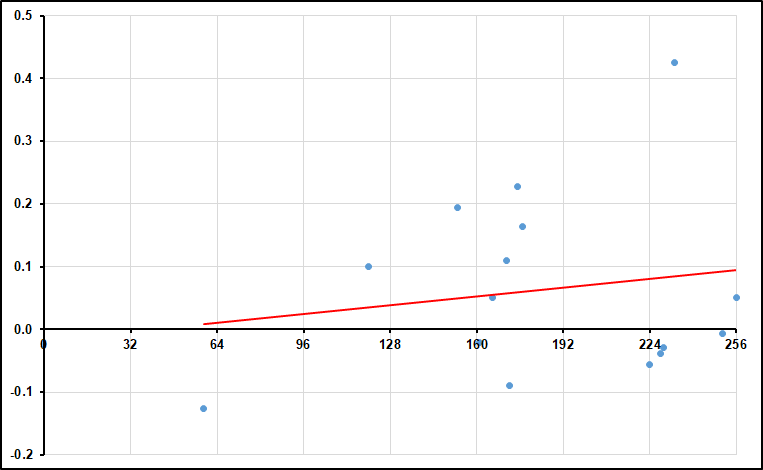
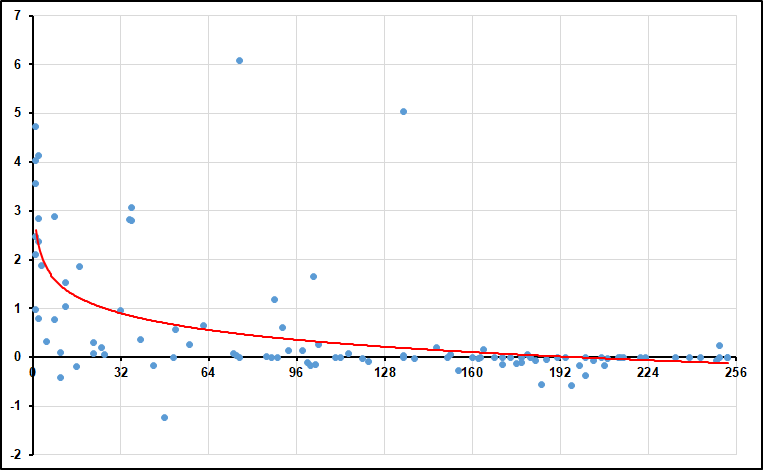
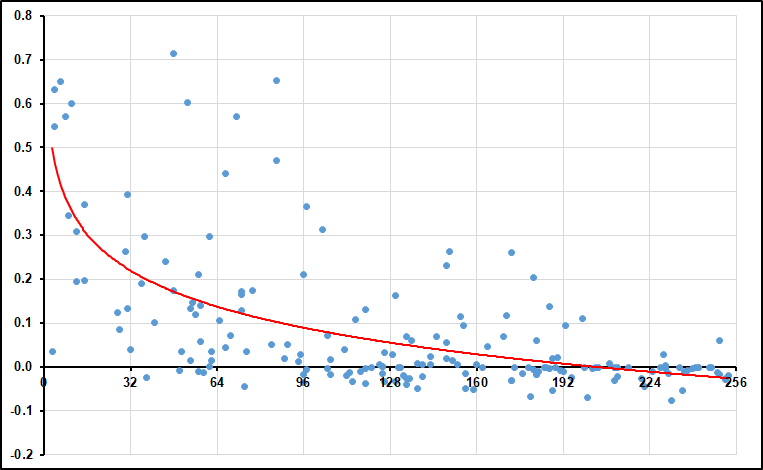
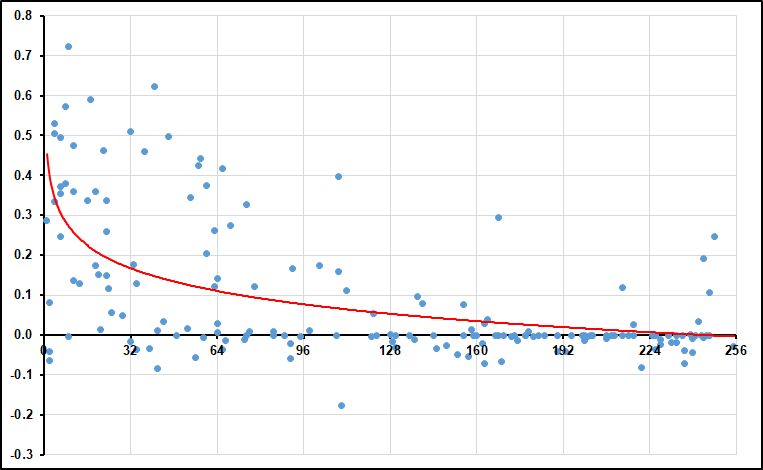
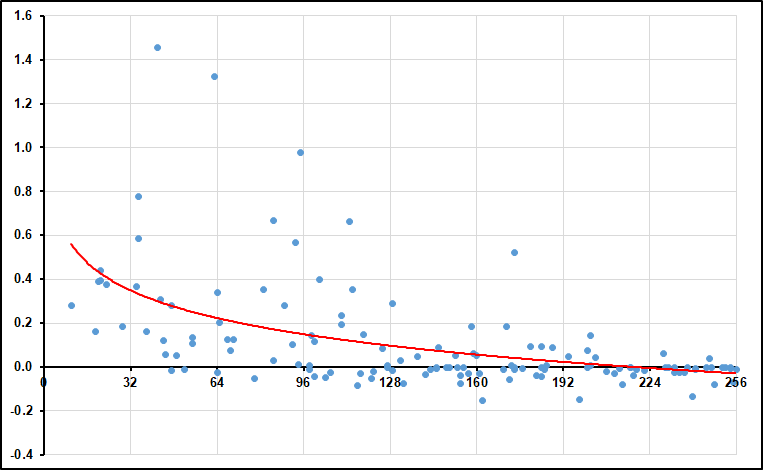
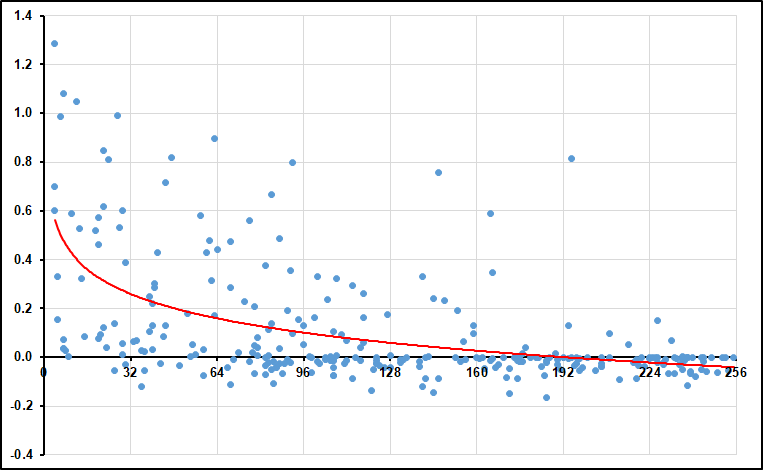
Below we provide an equivalent graph for each position to the original overall graph at the top of this article, showing each player's draft slot and average net points/game impact over a replacement player through their first 4 seasons, using the 2009-2017 draft classes. The trendlines shown (apart from kicker) are based on a natural log equation like the original graph, and can be compared to get an idea of the relative value of drafting players at different positions with each draft pick.
Center
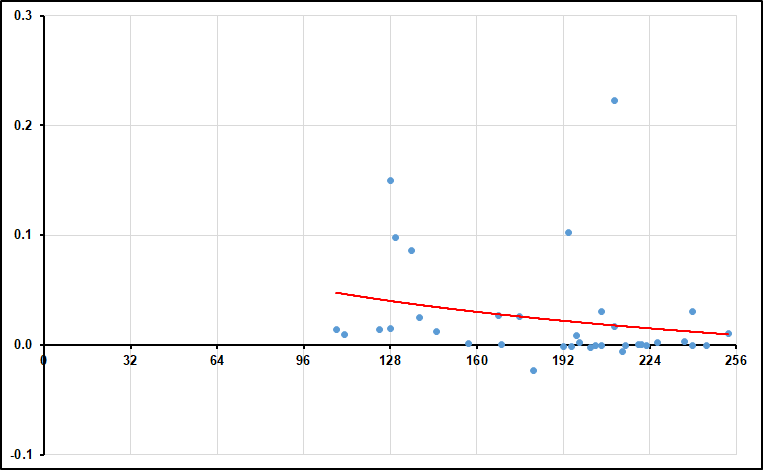
Cornerback
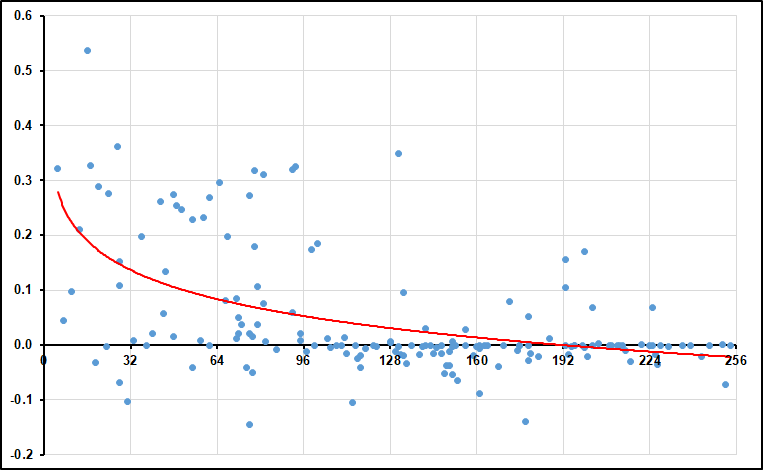
Edge Rusher
Fullback
Guard
Interior Defender
Kicker
Linebacker

Quarterback
Running Back
Safety
Tackle
Tight End
Wide Receiver
| Recent Articles |
|---|
| If 2021 Had 16 Games - 1/10/22 |
| Wk 18 Playoff Scenarios 2021 - 1/8/22 |
| Wk 17 Playoff Scenarios 2020 - 1/1/21 |
| Wk 17 Playoff Scenarios 2019 - 12/27/19 |
| 2 Week Playoff Scenarios 2019 - 12/21/19 |
| 3 Week Playoff Tiebreakers 2019 - 12/11/19 |
| NFL Injury Point Value - 6/18/19 |
| How Teams Value Draft Picks - 4/25/19 |
| Analyzing The Zion Injury - 3/21/19 |
| Week 17 Playoff Scenarios 2018 - 12/27/18 |
| BUF | MIA | NE | NYJ | BAL | CIN | CLE | PIT | HOU | IND | JAC | TEN | DEN | KC | LV | LAC | |||||||||||||
| DAL | NYG | PHI | WAS | CHI | DET | GB | MIN | ATL | CAR | NO | TB | ARI | LAR | SF | SEA | |||||||||||||
| ProFootballLogic.com welcomes questions, requests, and error reports by email to contact@profootballlogic.com | ||||||||||||||||||||||||||||
| Privacy Policy | ||||||||||||||||||||||||||||
| Copyright © 2024 ProFootballLogic.com. All Rights Reserved. | ||||||||||||||||||||||||||||